
All markets thrive on comparison. The real estate industry is no exception. Investors, lenders, and appraisers – just a few of the many professionals involved in a deal – all look at a potential investment in relation to its counterparts within the same market, and use similar metrics and ratios to assess the value of an opportunity.
Knowing these metrics and ratios can help you quickly evaluate a deal and save you time in identifying the most profitable deals. Furthermore, with these tools, you will be able to see the deal from the perspective of other investors or creditors, which will, without a doubt, facilitate the closing process.
Valuation Metrics
The two first questions you should ask yourself when looking at a deal are: (1) how much should I pay for this? and (2) will I make any money? The metrics below will be helpful in estimating both the value of the property, and how much income it could potentially generate.
PPSF — Price Per Square Foot
PPSF = Property Price / Building Area
The PPSF is exactly that: the average price of a square foot of the property. PPSFs are the first metric that lenders and investors will use to estimate a property’s current and future value, and should be relatively similar across similar properties in the same neighborhood.
NOI — Net Operating Income
NOI = Total Income - Total Expenses (excluding financing)
For rental projects, the Net Operating Income reflects the annual profit (or profit over some other period) that the property is expected to yield, excluding financing costs. The Total Income, or Total Rental Income, is the sum of all the rents collected annually. Total Expenses is the aggregate of all property management costs, taxes, insurance expenses, utility costs, repair costs, and all other expected expenses, not including the mortgage or loan payments for the year. Be sure to account for vacancies (usually expected to be around 5-10%), as well as marketing expenses. Financing costs are not included in this metric, as the NOI is meant to show how much income a property can generate regardless of how it’s acquired.
“Cap Rate” — Capitalization Rate
Cap Rate = Net Operating Income / Property Value
The Cap Rate is a widely-used ratio that simply measures how much profit a property can generate in relation to its price. For example, a $1,000,000 multifamily building that generates $50,000 in NOI would have a 5% Cap Rate.
Cap rates tend to be similar within the same market for each given type of property, and can therefore be a useful tool to evaluate the value of a deal. Since the NOI used in the formula does not include financing payments, cap rates can also be used to compare properties regardless of how they’re acquired.
For example, if the average cap rate for a recently renovated multifamily property in a specific neighborhood is 5%, and you’re looking at a similar property in the same neighborhood that generates an NOI of $60,000, you can use the formula in reverse to obtain a rough estimate of the property’s value:
$60,000 (NOI) / 5% (Cap Rate) = $1,200,000 (Property Value)
Financing Ratios
Once you’ve settled on a good deal and decided to borrow money to finance it, there are three main ratios your lender will likely use to determine how much they can lend, and two metrics that assess your ability to cover financing payments and make a profit.
LTV — Loan-to-Value
LTV = Acquisition Loan Amount / As-Is Value
The LTV ratio is the first key indicator of any lending deal, whether it’s a flip, a new construction, or a refinancing. It shows how much money is being initially borrowed in relation to what the property is worth at that time. For fix & flip loans, the LTV reflects the loan used for the acquisition of the property over the purchase price. For refinancings, the LTV reflects the loan proceeds used for refinancing divided by the property’s current appraised value. Most lenders will likely prefer to keep it not higher than 70-80%, meaning that you’ll be responsible for covering the remaining 20-30% yourself (or obtain mortgage insurance at an extra cost).
LTC — Loan-to-Cost
LTC = Total Loan Amount / Total Project Cost
Think of the LTC ratio as a more complete version of the LTV. It consists of the total loan amount (for fix & flip loans, this includes both the loan used for acquisition and the escrowed funds for construction), divided by the total cost of the project (how much it will cost to purchase and renovate the property).
LTARV — Loan-to-After-Repair-Value
LTARV = Total Loan Amount / After-Repair Value
The LTARV divides the total loan amount (purchase and renovation, if applicable) by the after-repair value of the property. It tells borrowers how much they’re lending against what the property will be worth once complete. Fix & flip lenders can expect this to be somewhat lower than the LTV, since the renovations will likely add enough value to cover both project and financing costs. The more value you add to the property, the lower the ratio will be, and potentially the higher the profit.
Cash Flow
Cash Flow = Net Operating Income (NOI) - Debt Service
A property’s cash flow reconciles the NOI with the property’s financing costs. Debt service is the total amount of the mortgage payments for the property. The cash flow represents the amount of cash left in your bank account at the end of the year. A negative cash flow is possible if the property’s NOI is not enough to cover the financing costs.
DSCR — Debt Service Coverage Ratio
DSCR = NOI / Debt Service
The DSCR is a metric often used by investors and lenders to see if a property’s income can cover financing payments. For example, if your property’s annual net income is $60,000, and your annual mortgage payments are $40,000, your DSCR would be 1.5x. A DSCR of lower than 1.0x would indicate that the property does not generate enough income to pay off its loan, and can often mean that the borrower is at higher risk of default.
Putting it All Together
To help you make sense of all these numbers, we put together a quick example. See if you can calculate the ratios yourself and arrive at the same figures using the project details given.
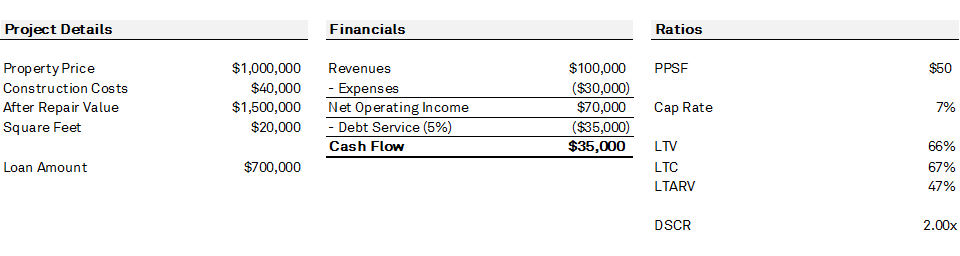
If you’re having any trouble memorizing these, click here to download an infographic you can save on your phone for quick reference.